Calculate your ideal Wedding Budget Calculator Percentage with smart priority rebalancing, location indexing, and risk analysis. Get instant budget health scores, spend-per-guest data, charts, and payment timelines.
| Paid | Due | Vendor/Task | Est. Amount | Status |
|---|
In the modern landscape of event planning, static spreadsheets and one-size-fits-all checklists are obsolete. A Wedding Budget Calculator Percentage must be dynamic, adapting to the specific financial realities of your location, guest count, and personal priorities. Traditional charts often suggest a flat 50% for venue and catering, but this fails to account for the couple who prioritizes high-end photography over a seated dinner, or the vast pricing difference between a wedding in New York City versus one in Texas.
The Wedding Budget Calculator Percentage tool presented here is engineered as a professional-grade financial instrument. Unlike basic calculators that simply divide a total sum, this intelligence engine employs a Priority Rebalance System. This feature mathematically redistributes allocation percentages based on what you value most—whether that is a “Foodie” experience, “Visuals,” or a “Party” atmosphere.
Furthermore, this tool integrates Location Factor Indexing, adjusting cost expectations and risk analysis based on regional pricing multipliers. By combining these inputs with a Spend-Per-Guest Health Analysis and a Negotiation Power Score, this calculator provides a realistic, data-driven financial roadmap. It does not just tell you what to spend; it analyzes the viability of your budget, identifies high-risk deficits, and generates a visual Doughnut Chart and a precise Payment Timeline to keep your cash flow positive throughout the planning lifecycle.
How the Wedding Budget Calculator Percentage Works
The efficacy of this tool lies in its algorithmic approach to fund distribution. It moves beyond simple division to offer a sophisticated financial model for wedding planning. Here is the breakdown of how the Wedding Budget Calculator Percentage processes your data.
Total Budget and Guest Count Logic
The foundation of any accurate calculation is the correlation between the total financial cap and the guest volume. The calculator starts by establishing a baseline using your Total Estimated Budget and Guest Count. These two figures immediately trigger the Spend-Per-Guest metric, which is the primary indicator of budget feasibility. A common error in manual budgeting is estimating category costs without cross-referencing the per-head expenditure required to service those categories.
The Priority Rebalance Engine
This is the core differentiator of this wedding budget percentage calculator. In a standard model, photography might be capped at 12%. However, if you select the “Visuals” priority profile, the engine activates a rebalancing algorithm. It automatically boosts the allocation for photography, videography, and decor by a specific factor (e.g., 1.35x), while proportionally reducing non-essential categories like stationery or transport.
- Foodie Profile: Shifts percentage weight toward Catering, Beverages, and Cake.
- Party Profile: Heavily weights Entertainment (DJ/Band) and Lighting.
- Balanced Profile: Maintains traditional industry-standard distributions.
Location Factor (Cost Indexing)
A budget of $30,000 has vastly different purchasing power depending on geography. This tool applies a Location Factor to its internal logic.
- High-Cost Zones (e.g., New York, San Francisco): The tool applies a multiplier (e.g., 1.8x) to vendor cost benchmarks.
- Moderate Zones (e.g., Texas, Florida): The tool uses standard or slightly adjusted baselines (e.g., 0.85x – 1.0x).
- Variable/International (e.g., India, UK): The tool adjusts for local labor and material cost variances. This indexing ensures that the risk analysis you see is relevant to your market, not a national average that doesn’t apply to you.
Dynamic Percentage Logic
The wedding cost percentage breakdown is never static. As you adjust your inputs, the backend logic recalculates the distribution across key categories:
- Venue & Catering
- Photography & Videography
- Attire & Beauty
- Decor & Florals
- Entertainment
- Planner
- Stationery
- Miscellaneous & Buffer The tool ensures the total always sums to exactly 100%, preventing the common “orphan math” error where manual spreadsheets exceed the total budget.
Key Intelligence Features
This tool offers more than just numbers; it provides financial intelligence. Understanding the “health” of your budget is as critical as knowing the specific dollar amounts.
Spend-Per-Guest Health Analysis
The most reliable metric for predicting wedding budget stress is the Spend Per Guest. The calculator divides your Total Budget by your Guest Count to generate this figure.
- Healthy Rating: The spend per guest aligns with current market rates for professional vendors in your selected region. This indicates a realistic plan.
- Moderate Risk: The budget is tight. You may need to compromise on specific vendors or rely on dates with lower demand.
- High Risk: The spend per guest is significantly below market norms for the region (e.g., expecting a luxury NYC wedding for $100/head). The tool flags this to prevent you from signing contracts you cannot fulfill.
Negotiation Power Score (0–100)
Timing is leverage. The calculator includes a seasonality database that analyzes your selected Wedding Date to generate a Negotiation Power Score.
- Seasonality Impact: A date in January or February (Off-Peak) often yields a high score (80-90/100), suggesting you have strong leverage to request discounts or added value.
- Peak Demand: A date in June, September, or October (Prime Peak) will yield a lower score (20-40/100), indicating a “seller’s market” where negotiating power is limited. This score empowers you to approach vendor meetings with realistic expectations regarding pricing flexibility.
Percentage Adjustment Alerts
The wedding budget allocation tool constantly monitors your category splits. If the Priority Rebalance Engine detects that a specific category is underfunded based on your total budget—for example, allocating only 2% to a planner when the standard is 5%—it adjusts the visualization to highlight where funds are tight. This proactive alerting system prevents the shock of hidden costs later in the planning process.
Inputs & Outputs
To maximize the utility of the Wedding Budget Calculator Percentage, it is essential to understand the data required and the comprehensive reports generated.
Inputs You Can Enter
- Total Estimated Budget: The absolute ceiling of your financial plan.
- Guest Count: The number of attendees (crucial for catering calculations).
- Location: The region where the event is taking place (US State averages, Major Cities, or International).
- Wedding Date: Used to calculate the payment timeline and negotiation score.
- Top Priority: The singular element that matters most to you (Venue, Photo, Decor, Party, or Balanced).
Outputs You Get
- Category Percentage Distribution: A precise breakdown of how much to spend on each vendor category.
- Spend-Per-Guest Rating: A financial health check (Healthy vs. High Risk).
- Negotiation Power Score: A strategic rating (0-100) based on seasonality.
- Doughnut Chart: A visual representation of your budget slices, rendered instantly via Chart.js.
- Payment Timeline: A generated schedule of deposit and final balance due dates.
- CSV Export: A downloadable file containing your entire financial plan for Excel or Google Sheets integration.
Example – Wedding Percentage Breakdown
To illustrate the power of the Wedding Budget Calculator Percentage, let us look at a specific scenario utilizing the tool’s advanced logic.
Scenario Inputs:
- Total Budget: $30,000
- Guest Count: 120
- Location: California / NE (1.4x Cost Factor)
- Priority: Visuals (Photography & Video focus)
- Wedding Month: September (Prime Peak)
Generated Results: Upon calculation, the tool processes the “Visuals” priority. Instead of the standard 12% allocation for Photography/Video, the engine boosts this category to roughly 16-17%, reducing the allocation for Stationery, Transport, and Gifts to compensate.
- Spend Per Guest: $250.
- Analysis: For California, $250/head is a Moderate to Healthy budget. The tool confirms this is a workable number for professional vendors.
- Negotiation Power Score: 25/100.
- Analysis: September is a peak month. The tool warns that negotiation leverage is low; the couple should expect full pricing.
- Visuals Distribution:
- Photography/Video: ~$4,800 – $5,100 (Allocated higher due to priority).
- Venue/Food: ~$11,000 (Adjusted slightly to accommodate visuals).
- Decor: ~$3,200 (Boosted slightly as part of the visual experience).
- Payment Timeline:
- Photo Deposit (Due Nov previous year): $300 (approx).
- Venue Deposit (Due immediately): $2,200.
- Final Balances (Due August/September): The tool populates these dates automatically based on the input date.
This level of detail transforms a simple number—$30,000—into a strategic execution plan.
Factors That Affect Wedding Budget Percentages
A static list of percentages is rarely accurate because wedding finance is fluid. Several variables influence the ideal wedding expense percentage calculator outputs.
Priority Choices
The “Average” wedding budget allocates 40-50% to Venue and Catering. However, if your priority is Entertainment, a smart calculator must shift at least 3-5% from other categories (like Decor or Attire) to fund a high-end band or extensive lighting rig. The math must balance; you cannot simply add percentage points without subtracting them elsewhere.
Guest Volume
The “Per-Head” costs (Catering, Bar, Rentals, Invitations) are strictly linear. A wedding with 200 guests requires a significantly higher percentage of the budget dedicated to food and beverage compared to a wedding with 50 guests. As guest count rises, the percentage available for fixed costs (Photographer, DJ) naturally compresses unless the total budget increases.
Seasonality & Negotiation
While seasonality doesn’t directly change the percentage assigned to a vendor, it affects the value you get for that percentage. As indicated by the Negotiation Power Score, a winter wedding might allow your 40% Venue budget to secure a premium ballroom that would otherwise cost 60% of your budget in June.
Location Cost Index
Geography is the silent budget killer. The Wedding Budget Calculator Percentage adjusts for this using a location index. In high-cost regions (NYC, London), the “floor” for vendor pricing is higher. This often means the percentage allocated to labor-intensive categories (Service, Planner, Photo) must be protected, as these vendors cannot lower their rates below the living wage of the region, regardless of your total budget.
Who Should Use This Calculator
This wedding budget distribution calculator is designed for users who require more than a rough estimate. It is an essential tool for specific groups planning a major event.
1. Rules-Based Financial Planners: Couples who prefer logic and data over guesswork will appreciate the breakdown. If you want to know exactly why your photography budget is $4,000, this tool provides the mathematical justification based on your total spend.
2. High-Cost Region Planners: If you are planning a wedding in a major metropolitan hub, generic advice will lead to overspending. You need a wedding vendor percentage guide that accounts for the 1.4x or 1.8x markup inherent to your location.
3. Negotiation-Focused Users: Couples looking to maximize value can use the Negotiation Power Score to test different dates. By changing the input date from October to February, users can see the “Leverage Score” rise, providing a data point to discuss with partners.
4. Efficiency Seekers: The automatic Payment Timeline generation is ideal for those who need a to-do list immediately. Instead of manually calculating when 50% of the catering bill is due, the tool provides the dates instantly.
FAQs: Wedding Budget Calculator Percentage
What are standard wedding budget percentages?
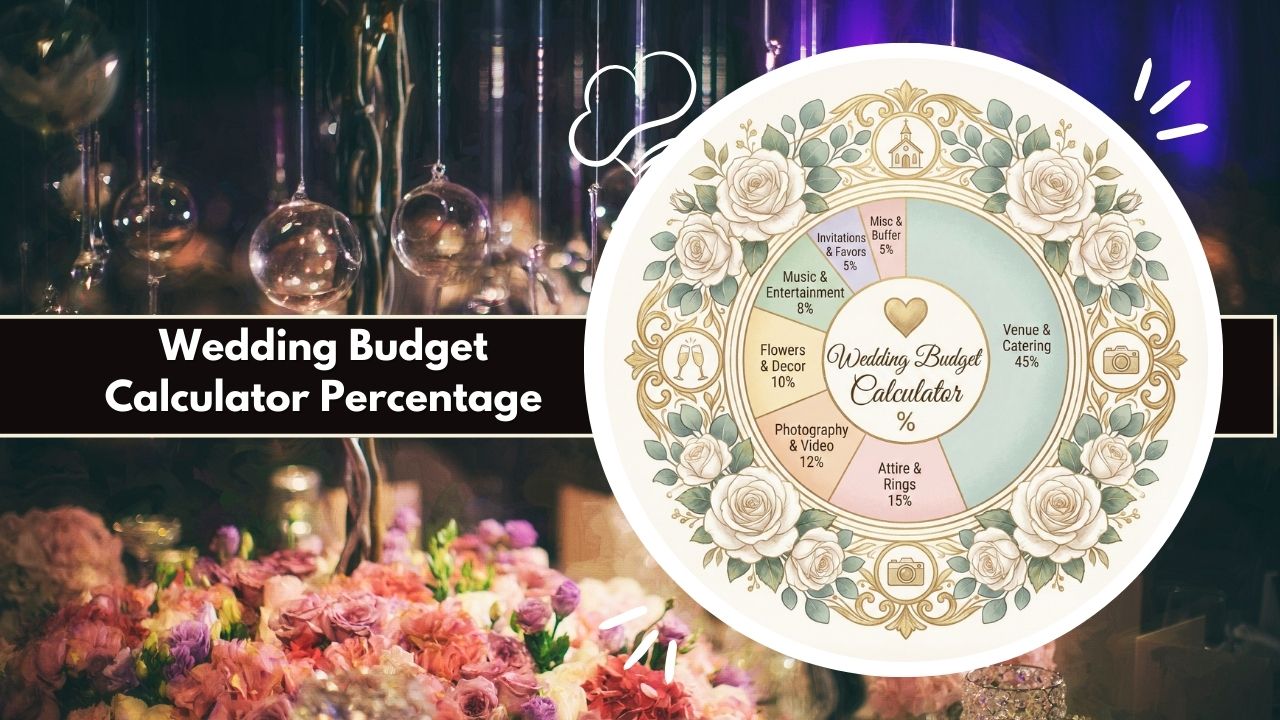
While they vary by priority, standard industry baselines are generally: Venue & Catering (40-50%), Photography & Video (10-12%), Attire & Beauty (8-10%), Decor & Florals (10%), Entertainment (8%), Planner (5-10%), and Miscellaneous/Buffer (5%). Our tool adjusts these dynamically based on your specific inputs.
How does the priority rebalance system work?
When you select a priority (e.g., “Party”), the Wedding Budget Calculator Percentage engine applies a multiplier to relevant categories (Entertainment, Alcohol) to increase their funding. To keep the budget balanced at 100%, it proportionally reduces the percentage allocation of non-priority categories (like Paper Goods or Cake) without eliminating them entirely.
How accurate is the spend-per-guest health score?
The health score is highly accurate as a feasibility indicator. It compares your per-head available spend against regional market averages. If the tool marks your budget as “High Risk,” it means your current guest count is likely too high for your total budget in that specific location.
Does location really change vendor percentage distribution?
Yes. In high-labor-cost regions (like NYC or LA), service-based categories (Planner, Photo, Catering Staff) often demand a higher percentage of the total budget compared to regions with lower costs of living. The Location Factor in our tool accounts for these market variances.
What affects negotiation leverage the most?
Seasonality and Demand. The Negotiation Power Score is primarily driven by your wedding month and day of the week. Off-peak months (January-March) and non-Saturdays offer the highest leverage, while peak months (May, June, September, October) offer the lowest.
How does the tool generate the payment timeline?
The tool uses standard vendor contract structures (e.g., Booking Deposit, Mid-way Payment, Final Balance). It takes your entered Wedding Date and works backward, calculating the specific calendar dates when these payments are typically due for each category.
Can I export my wedding budget percentage plan?
Yes. The tool includes a “Download CSV Plan” button. This generates a spreadsheet file containing your customized category breakdown, percentage allocations, exact dollar amounts, and your generated payment timeline dates for offline use.
Related Tools & Calculators:
- Engagement Ring Budget Calculator
- Holiday Budget Calculator
- Budget Calculator For Trip
- Marriage Budget Calculator
- Joint Budget Calculator
- Couples Budget Calculator
- Grocery Budget Calculator
- Food Budget Calculator
- Vehicle Budget Calculator
- Lifestyle Budget Calculator
- Living Budget Calculator
- Household Budget Calculator
- Rent Budget Calculator
- Daily Budget Calculator